Measurement and verification
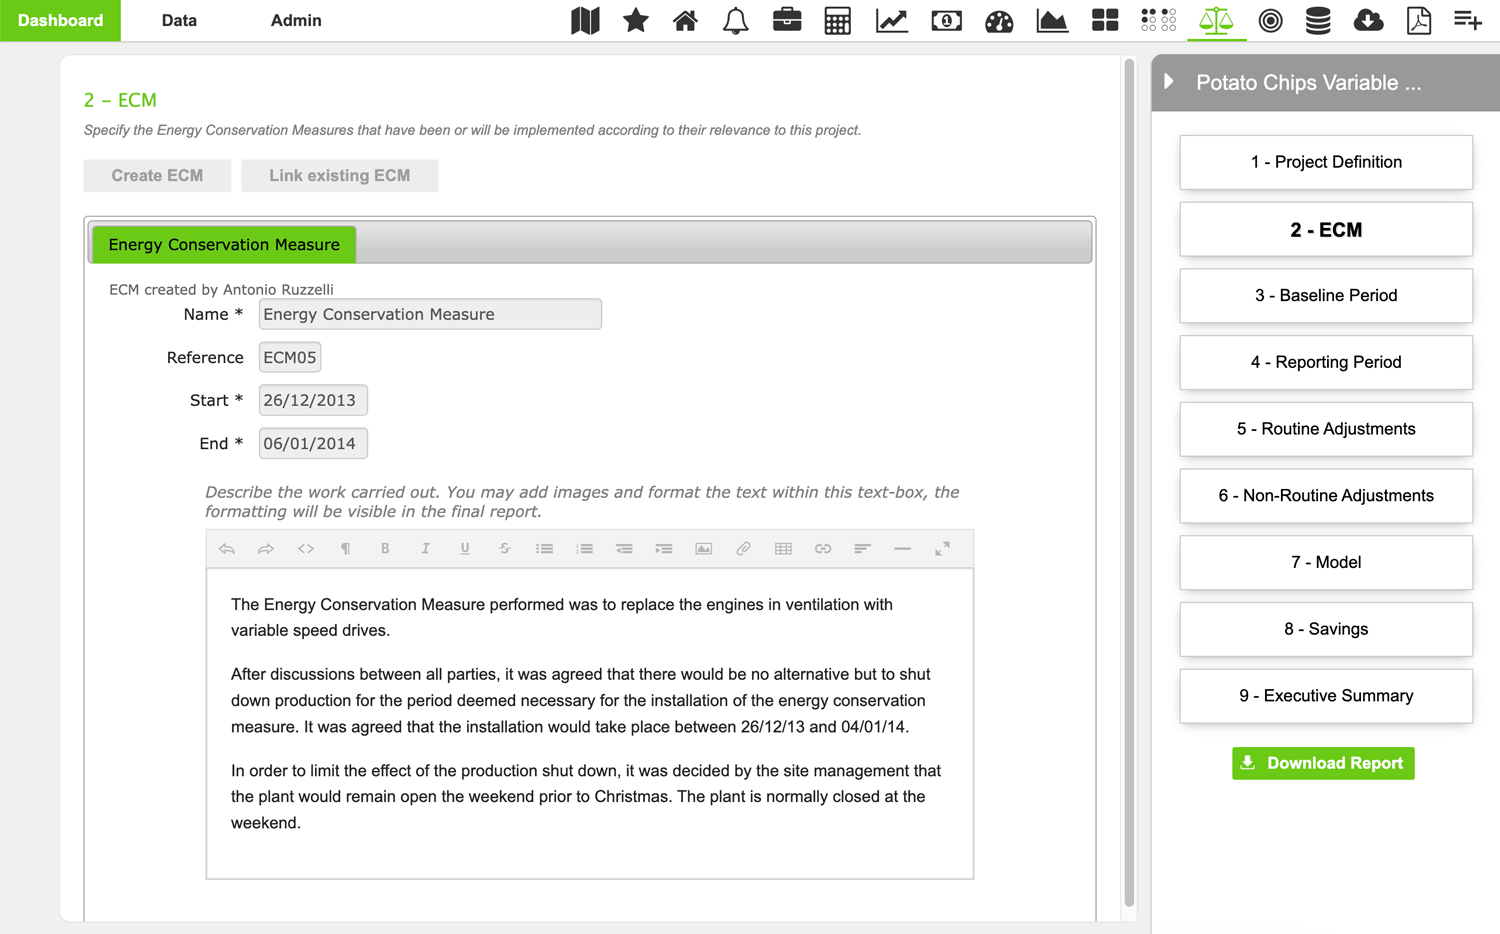
EnergyCAP SmartAnalytics can help you streamline your ISO 15001 projects, energy performance contracts, or any other energy efficiency contracts where savings must be proven. This tool lets you standardize and centralize the projects following the International Performance Measurement & Verification Protocol (IPMVP).
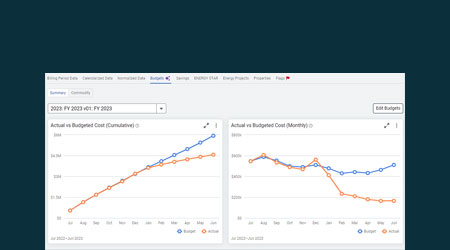
Create new M&V projects using IMPVP Option B or Option C methodologies. Specify the energy conservation measures implemented, set your baseline and reporting period, include routine adjustments, and see visualizations of your energy savings achieved.
 Best-in-class portfolio-level energy and utility bill data management and reporting.
 Real-time energy and sustainability analytics for high-performance, net-zero buildings.
 A holistic view of financial-grade scope 1, 2, and 3 carbon emissions data across your entire business.
 Energy and sustainability benchmarking compliance software designed for utilities.