


Auckland University of Technology
Direct Control needed a solution for its client, Auckland University of Technology, to help identify energy inefficiencies and monitor energy consumption.
Headquarters
EnergyCAP, LLC
360 Discovery Drive
Boalsburg, PA 16827
Denver, CO
Suite 500
5445 DTC Parkway
Greenwood Village, CO 80111
Dublin, Ireland
Unit F, The Digital Court, Rainsford Street,
Dublin 8, D08 R2YP, Ireland
Phone: 877.327.3702
Fax: 719.623.0577
In July 2019, Direct Control, a New Zealand-based building management system (BMS) and system control specialist, approached EnergyCAP SmartAnalytics™ (formerly Wattics) seeking a cloud-based energy analytics software to integrate with its existing LoRaWAN IoT sensor platform—with the view to expand its analysis capabilities for the benefit of its commercial and industrial energy management projects.
Direct Control subscribed to EnergyCAP SmartAnalytics white-labeled software, which allowed it to re-brand the energy dashboard to reflect the company’s corporate brand—and add the branded dashboard as part of its offering and market it as its technology.
Shortly after signing up, Direct Control initiated a trial project with its client, the Auckland University of Technology (AUT), under which it evaluated the potential of the EnergyCAP SmartAnalytics machine-learning energy analytics software to help the project team to:
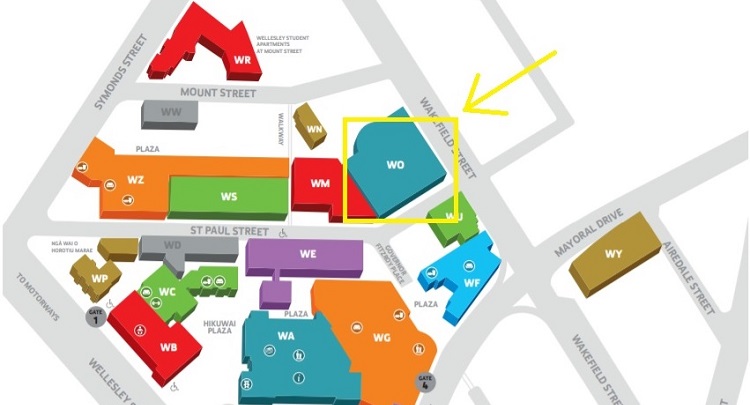
Image 1: WO building location on the AUT university campus
The subject of the trial project was AUT’s WO building which had Direct Control’s LoRaWAN IoT sensor platform, IQnexus, already installed. EnergyCAP SmartAnalytics was integrated with the IQnexus platform via the Wattics RESTful API, allowing the electricity use data from the IoT platform to Direct Control’s branded energy analytics dashboard for analysis.
EnergyCAP provided Direct Control with technical support and testing to ensure that the data from its IQnexus platform was received by EnergyCAP SmartAnalytics correctly.
The image below shows Direct Control’s IQnexus portal embedded into the EnergyCAP SmartAnalytics dashboard allowing the team to log in and get quick access to data pertinent to their analysis activities without leaving the dashboard.
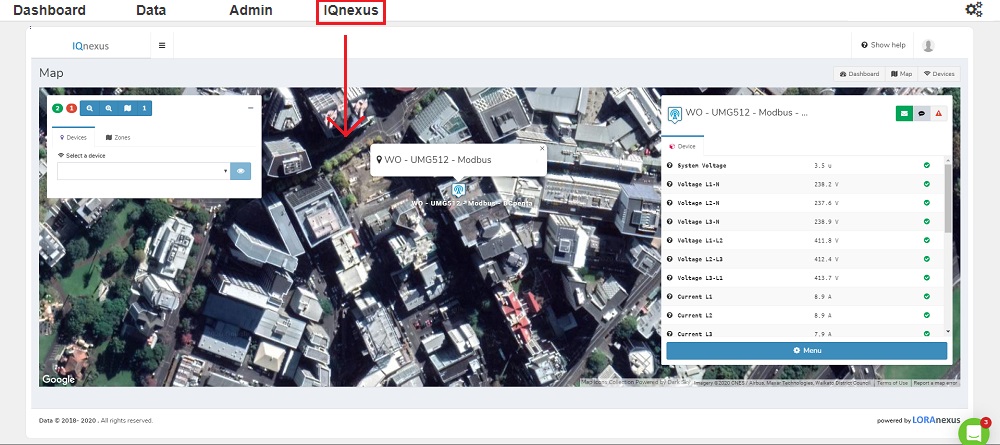
Image 2: Direct Control can access data from their IQnexus technology platform using the Embedded Pages tool
EnergyCAP provided Direct Control with technical support and testing to ensure that the data from its IQnexus platform was received by the EnergyCAP SmartAnalytics platform correctly. Once EnergyCAP SmartAnalytics received electricity readings from the IQnexus platform generated from the LoRaWAN Modbus Transceiver, which is wired up to the main incomer of the building, the project team could start running analyses and begin to identify opportunities for energy savings.
WO Building Overview
The first step toward identifying energy-saving opportunities for AUT’s WO building was to conduct an audit of the building’s overall energy use. Through the audit, Direct Control found that the HVAC was operating during some weekends in the year (Jan ’18–Jan ’19) due to control rules in the building’s BMS having been overwritten to set the air handling units (AHUs) to “ON.”
The analysis of heating and cooling degree day data against kWh consumption also found that the air conditioning (cooling) was automatically turned on, despite the outside temperature being at optimum levels. The AHU supply fan was overworked and identified as a key contributor to excessive energy consumption.
The project team undertook several energy conservation measures that targeted the HVAC and BMS operation in order to correct the energy inefficiencies identified at the university’s WO building. These included:
Supply pressure setpoints reset: Periods of AHU operation have been identified where the AHU Supply Pressure Setpoint could be reset to a lower value. During periods when all the associated variable air volume (VAV) damper positions are below 50%, the AHU Supply Pressure Setpoint could be lowered.
Supply air temperature setpoints reset: Periods of AHU operation have been identified where the AHU Dampers are not controlled correctly. Instead of the AHU Damper Position being modulated to control the AHU Supply Air Temperature to the required Setpoint, it is operated using an OPEN/CLOSE function.
Through the EnergyCAP SmartAnalytics *IPMVP Measurement and Verification (M&V) project management tool, the team at Direct Control conducted a comprehensive analysis to verify the actual savings after each ECM was implemented, as well as the forecasted annual savings (kWh and $) and payback period after both ECMs had been implemented.
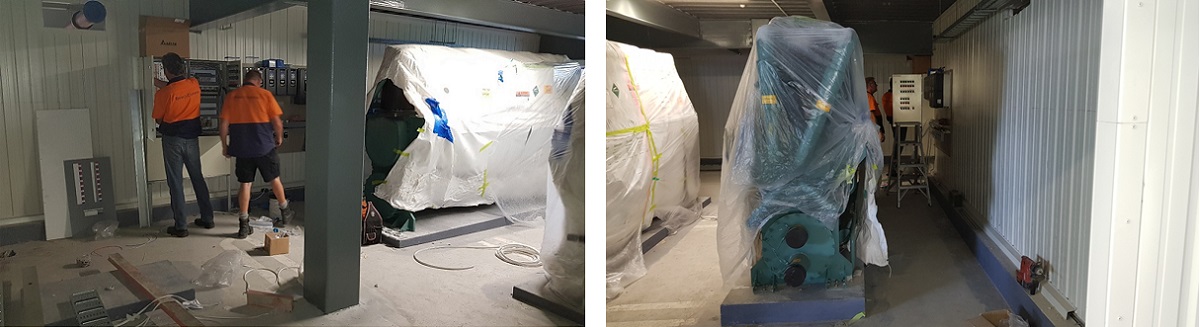
Image 3: Installation of the higher efficiency chiller
The analysis also accounted for routine/non-routine adjustments, heating/cooling degree days, and building occupancy (as shown in Figure 1 below) to normalize the kWh consumption data.
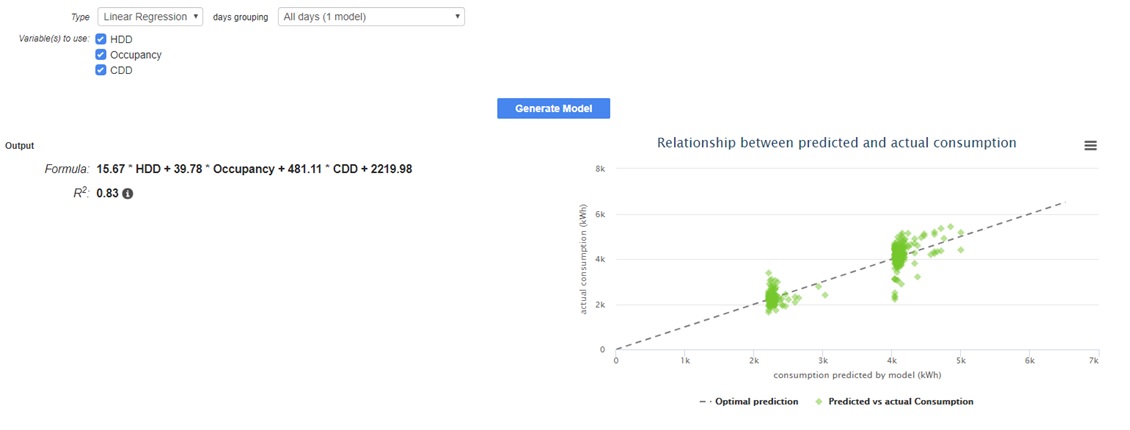
Figure 1: M&V regression analysis using three independent variables: HDD, CDD and occupancy | Source: Direct Control
Below, the M&V tool models forecasted savings after the energy conservation measures under the trial were implemented.
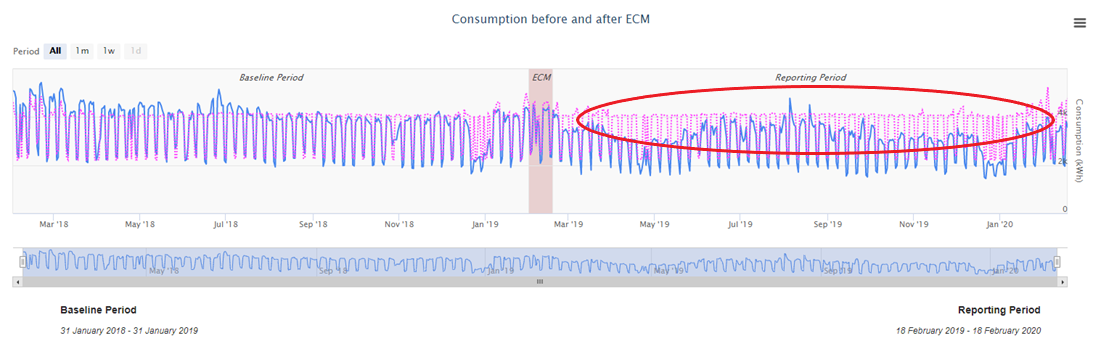
Forecasted Savings Model (AUT – WO Building) | Source: Direct Control
The energy conservation measures implemented resulted in savings that far exceed the initial target of 10% kWh savings per year. Project results demonstrate an 18% reduction in energy use after one year, NZ$ 32,725 per annum (US$ 20,616 / €18,653) in cost savings, and a payback period for HVAC optimization of 7.85 years.
Direct Control is dedicated to maintaining the savings achieved through continuous monitoring and analysis. The company is also investigating further energy-using entities to improve savings while maintaining optimal performance within the WO building. As a result of the savings achieved under the pilot project, AUT has commissioned Direct Control to begin work on additional buildings located at the university campus.

The University of New Mexico’s (UNM) main campus was founded in 1889 and currently consists of 165 facilities over approximately 800 acres in scenic Albuquerque. Six branch campuses across the state add nearly 200 facilities, bringing the university’s total usable space to more than 12 million square feet.

Texas State University (TxState) is the largest university in the Texas State University System and the fifth-largest university in Texas. The university provides undergraduate and graduate degree programs for more than 34,000 students at San Marcos and Round Rock campuses.

The University of Kansas is a major teaching and research institution.