


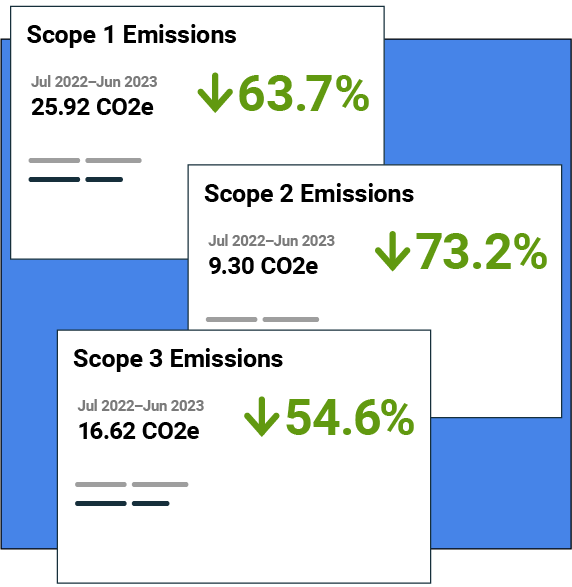


Get best-in-class portfolio-level energy and sustainability reporting. Get accurate and reliable energy and utility data across your entire portfolio and streamline energy and accounting workflows.
Key Features
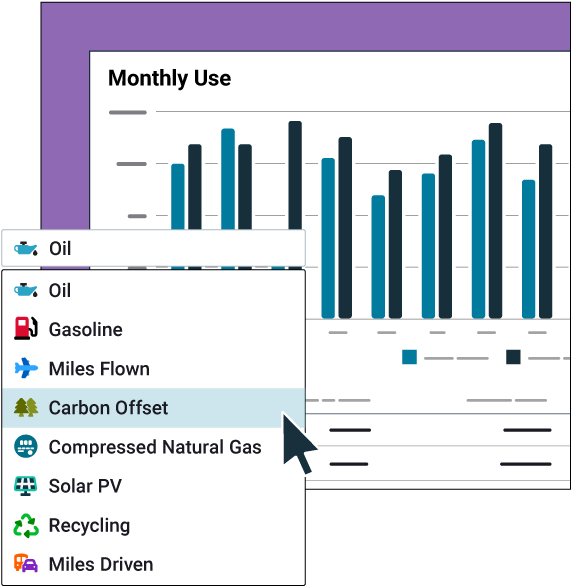
- Accurate utility bill data, always
- Easy facility benchmarking
- Chargebacks and tenant billing
- Integrate with ENERGY STAR
- Measurement and verification