
- Who We Help
- Solutions
- EnergyCAP UtilityManagement
 Best-in-class portfolio-level energy and utility bill data management and reporting.
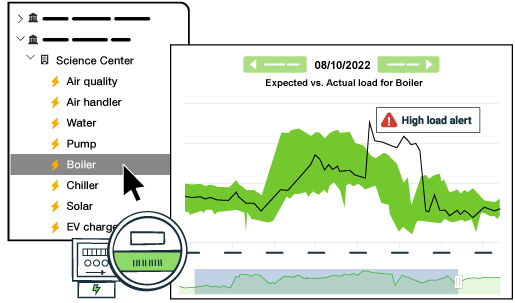
- EnergyCAP SmartAnalytics
 Real-time energy and sustainability analytics for high-performance, net-zero buildings.
- EnergyCAP CarbonHub
 A holistic view of financial-grade scope 1, 2, and 3 carbon emissions data across your entire business.
- EnergyCAP Utility Company Platform
 Energy and sustainability benchmarking compliance software designed for utilities.
- EnergyCAP UtilityManagement
- Success Stories
- Resources
- Company