Third-Party Integrations
Headquarters
EnergyCAP, LLC
360 Discovery Drive
Boalsburg, PA 16827
Denver, CO
Suite 500
5445 DTC Parkway
Greenwood Village, CO 80111
Dublin, Ireland
Unit F, The Digital Court, Rainsford Street,
Dublin 8, D08 R2YP, Ireland
Phone: 877.327.3702
Fax: 719.623.0577
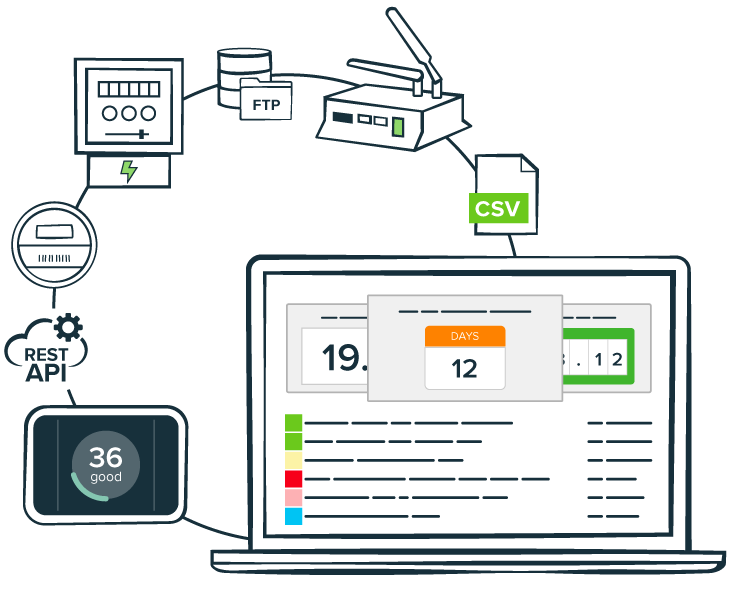

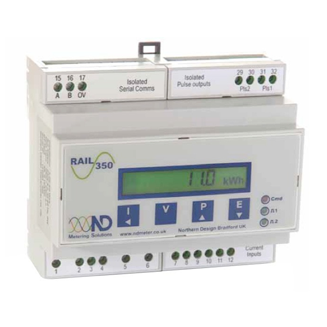
A key element to the success of our platform is the ability to integrate data streams from a variety of data collection systems, files and repositories. EnergyCAP SmartAnalytics supports a portfolio of data integration mechanisms, and ensures that all data collected at our customers’ sites is seamlessly incorporated with industry-standard communication interfaces.
Connect today with any of our established integrations. Not seeing what you are looking for? No problem! We can build an integration to meet your needs. Looking for integration instructions? Visit the EnergyCAP Help Center.